Since September 2022, I’ve been collecting SaskPower daily generation data with my Saskatchewan Electricity Mix project. Using that data I will show how nuclear power is ideally suited to supply Saskatchewan’s power demand.
Power demand in Saskatchewan is fairly constant on average; the minimum load experienced in SaskPower’s 2022-23 reporting year was 2,032 Megawatts (MW). This is the minimum amount of constant power required to run homes, businesses, industry, hospitals, schools, farms, mines, and more.
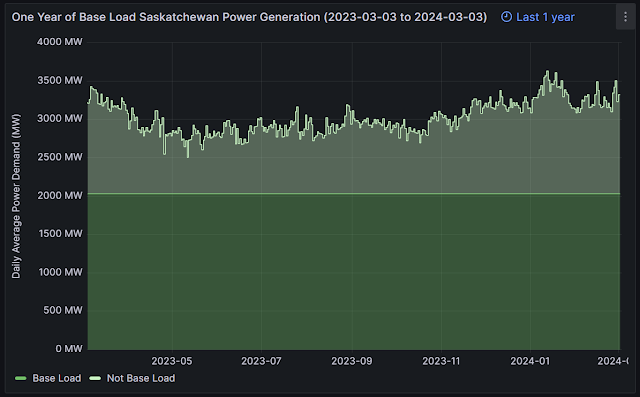
The chart above shows one year of daily average power demand numbers, with the 2,032 minimum load labeled as “base load”.
The bulk of our power demand and consumption is constant.
Dispatchable power is needed to serve base demand
Capacity Factor is the ratio (%) of the power produced by a generating asset (or fleet of assets) from its installed capacity.
This chart illustrates the per-source daily capacity factor for each of SaskPower’s power reporting categories: coal, gas, wind, hydro, solar, and “other” (which includes contracted Manitoba Hydro imports, bioenergy, and small IPPs).
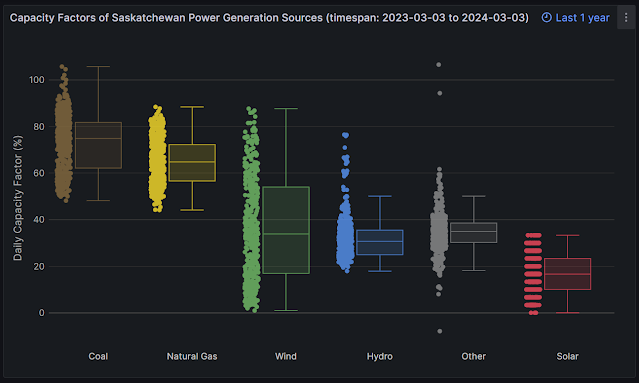
Each dot represents one day’s capacity factor. The box-and-whisker plots highlight the median value (line in the middle box), operating quartiles (each box or whisker contains approximately 25% of values), and outliers (more on how to read box plots).
We can see that Saskatchewan uses coal, gas, and hydro to meet demand continuously, because the capacity factor of these assets never nears zero. They are dispatchable, controllable power sources. With wind and solar we take what power we can get, and some days the capacity factor of those asset fleets is at or near zero.
Saskatchewan wind is great, but…
At about 37% annual capacity factor (the middle bar in the box plot above), wind power in Saskatchewan is a great resource relative to wind power in other regions. But the wind is highly variable.
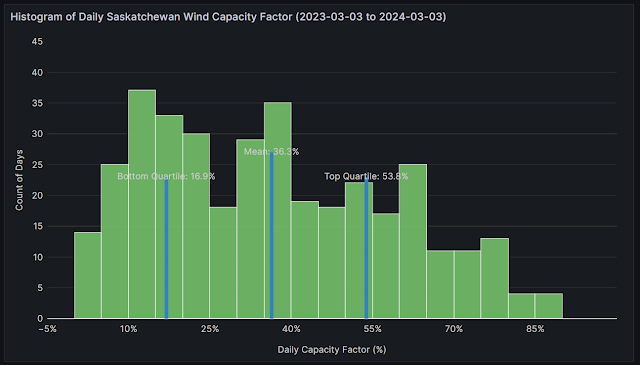
Let’s define a “calm” day as bottom-quartile wind performance: the one-quarter of days contained in the bottom whisker of the plot above, where wind produced less than ~17% of its installed capacity.
In the last 12 months, the longest “calm streak” we’ve experienced - concurrent bottom-quartile days with our geographically-distributed wind fleet - is seven days (two of them, in fact).
Plotting wind performance as a histogram may help further visualize the variability. For example, there were 14 days where the wind fleet’s capacity factor was between 0% and 5% of installed capacity.
Best-in-Canada solar…?
Saskatchewan is said to have some of the best solar resources in Canada, but this is a bit like saying the Okanogan Valley is the best place in Canada to grow avocados. The best is not that good.
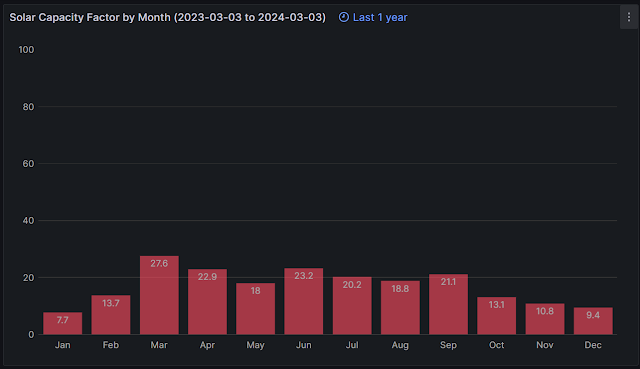
Using SaskPower’s daily generation data we calculate an annual solar capacity factor of about 17.2% (consistent with a City of Saskatoon study; PDF). For every 100 MW installed, we average (over a year) 17.2 MW of generation. In contrast, solar’s capacity factor for sunny equatorial regions can exceed 30%.
Solar performance is especially poor in Saskatchewan winters:
A common claim (or misconception) is that solar generation aligns with peak loads; the highest load experienced by a grid in a year. This is true for some sweltering southern grids with late afternoon summer A/C loads, but not Saskatchewan’s winter-peaking grid.
The chart below shows the last 8 months of daily peak loads, and if the peak load occurred when the sun was up (and solar would be producing) or down. Note the 8-month timespan is due to data availability, not deliberately excluding data.
Saskatchewan’s annual peak - the day or hour with the highest load - consistently occurs in winter, when the sun is down (at 4pm!). The conclusion is that solar’s effective load carrying capacity during winter peak loads - where the peaks are the highest - is zero.
Hydro is not as dependable as we might hope.
In the last year, hydro’s capacity factor has averaged about 32%, likely due to low moisture levels, drought conditions, and the fact that hydro dams support other functions of irrigation, flow, and control.
As a result, in the last 6 months we’ve been utilizing just 200-300 MW (daily averages) from our nearly 900 MW of hydro generation capacity, often at much lower levels than the year before.
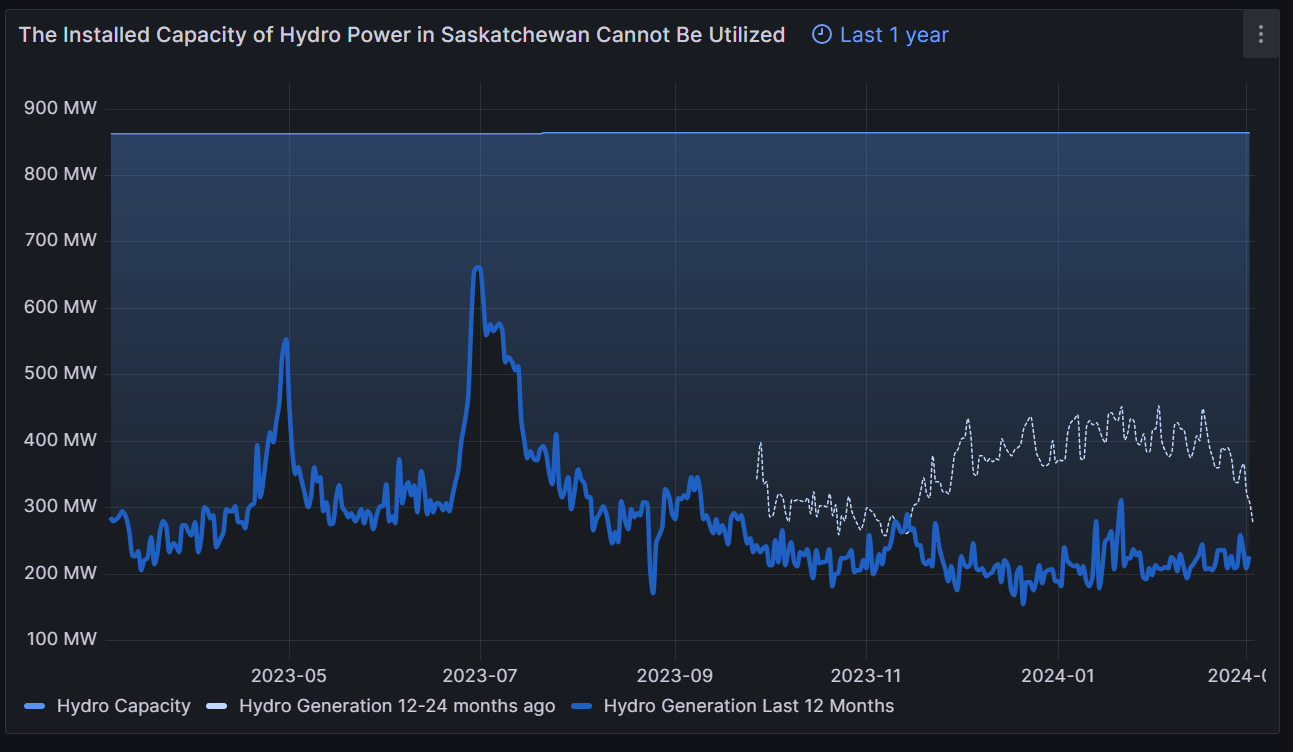
In their most recent Integrated Resource Plan, Manitoba Hydro indicated they will not have excess hydro to export to Saskatchewan, in the long term.
Critical analysis of renewables is not anti-renewable
Believe it or not, I am not opposed to renewable (wind/solar/hydro) energy. If decarbonization is the goal, many solutions will be required to transform and update Saskatchewan’s grid, including renewables and energy storage.
My concern, looking at the data, is hearing unrealistic ideals and perceptions about the real-world utility of renewable power. It is not realistic to depend solely on renewable power, unless we want blackouts, curtailments, or a large dependency on imported power.
Could battery storage mitigate renewable intermittency?
Some batteries on our grid will be beneficial for tight frequency control and near-instant response to other failures. However, the quantity of batteries required to store long-duration power from renewables is staggering.
Here's the math: if our daily average power consumption is 70 GWh, we’d need 490 GWh of energy storage to get through a 7-day calm streak (as described above) on a wind-dominant, zero-fossil grid in the dead of winter. This amount of storage is equal to about 25,000 20 MWh batteries (like the one SaskPower is deploying in Regina), or 36,000,000 Tesla Powerwall units.
This is an extreme and slightly absurd example, but a small fraction of that storage is a huge amount.
Nuclear power is the most reliable source of electricity
Let’s finally discuss nuclear power and start with reliability. Ontario's fleet of reactors (below) provides uninterrupted zero-carbon power 24/7/365 under any weather conditions.Just this week, one of Ontario’s nuclear reactors reached 600 days of continuous runtime.
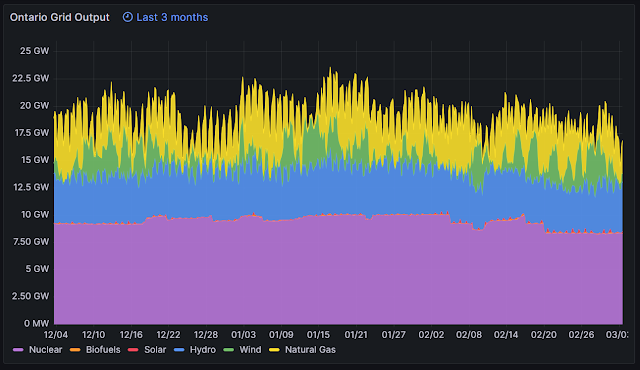
Omitting hydro due to Saskatchewan's limited options, Ontario is a great model for Saskatchewan's future grid.
Nuclear is the anchor. Wind and solar reduce natural gas use. Gas and hydro flex to meet demand and manage wind and solar intermittencies.
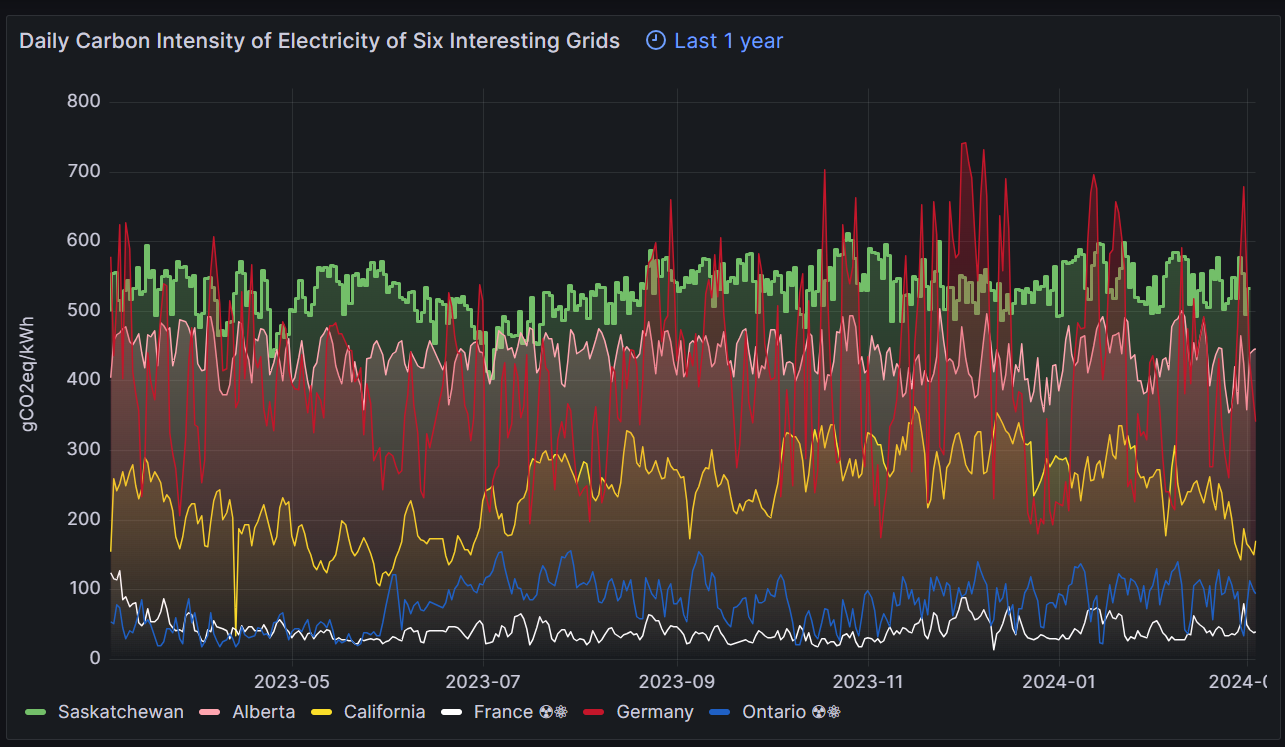
Nuclear power excels at decarbonizing electrical grids.
Pictured is the daily carbon intensity of electricity of fossil-heavy Saskatchewan and neighboring Alberta, renewable-heavy Germany and California, and nuclear-heavy France and Ontario.
If decarbonization is the goal, what is the answer?
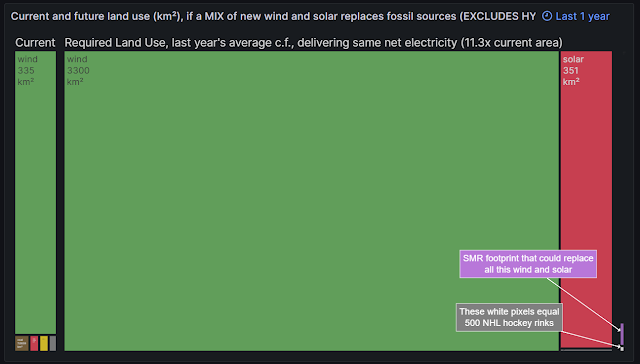
Nuclear power has the smallest lifecycle land footprint.
Here we illustrate the lifecycle land use intensity of our current grid, and grid decarbonization using a mix of wind and solar (with approximately 4:1 ratio of installed capacity, per 2030 projections from SaskPower) OR nuclear power.
Lifecycle land use includes mining (of fuel and construction materials), the actual plant site, and waste management (landfills, nuclear spent fuel)..
If the goal of environmentalism is minimizing impacts on our natural resources, nuclear is the clear leader.
Conclusion
Geographically, Saskatchewan is challenged to produce reliable electricity from wind, solar, and hydroelectricity to meet demand, as shown by this real-world data, despite “best-in-Canada potential”.
Electricity produced from coal, natural gas, and hydro power share many of nuclear power’s positive attributes, and all of these base load power sources have varying levels of social license and support. Nuclear power however, not without its own challenges and drawbacks, is a clear win for reliability, energy security, environment, carbon intensity, and the ability to serve base load.
An “always live” version of the charts in this piece can be found here, including links to sources and other notes about the data.
No comments:
Post a Comment